When developing a project. We work with client sponsors in these service areas as well as identifying who the important stakeholders are in a project and what the business is getting out of the exercise and investment.
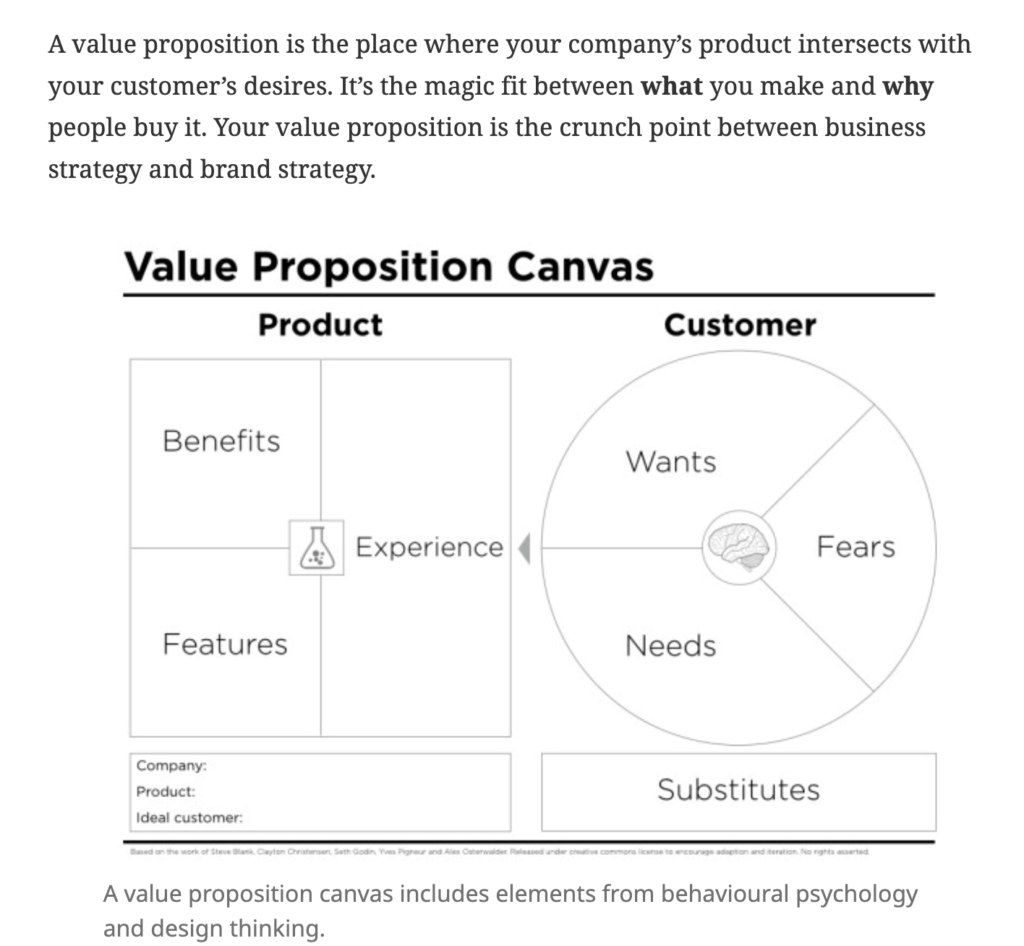
As part of our processes, we work with clients to create a Business Value Proposition Diagram to solidify requirements and clearly define the payoff relative to these key stakeholders that need to benefit from these projects.
This article titled Value Proposition Canvas Template by Peter J Thomson explains this process and its value in detail.
See image below for what a sample report template looks like:
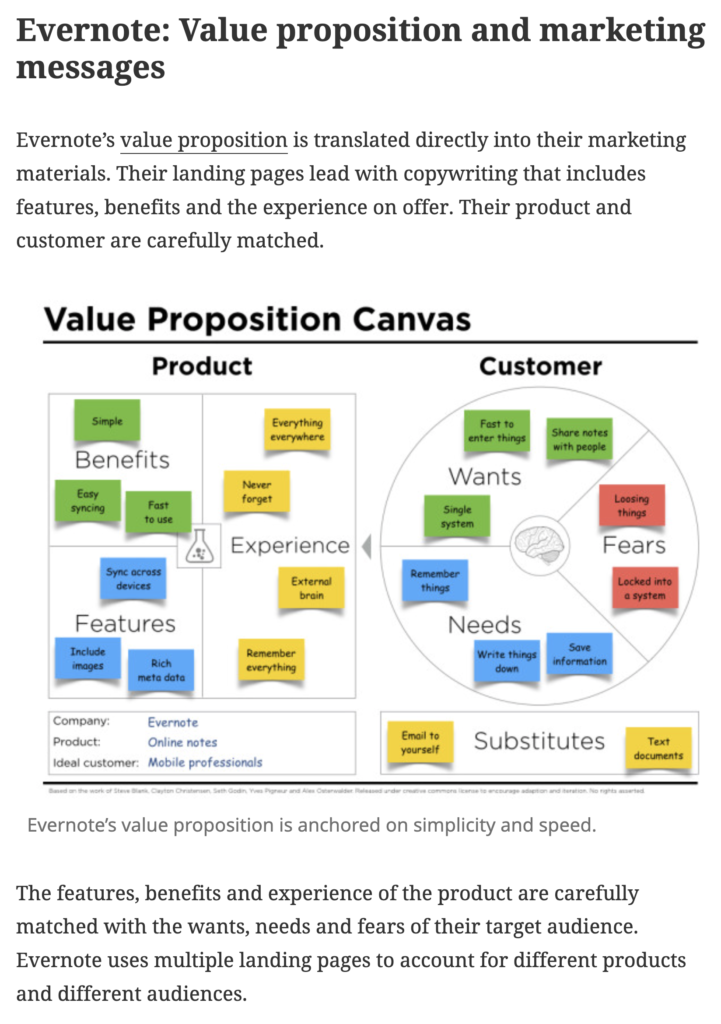
A finished Diagram would look like this example implemented by Evernote, Inc.:
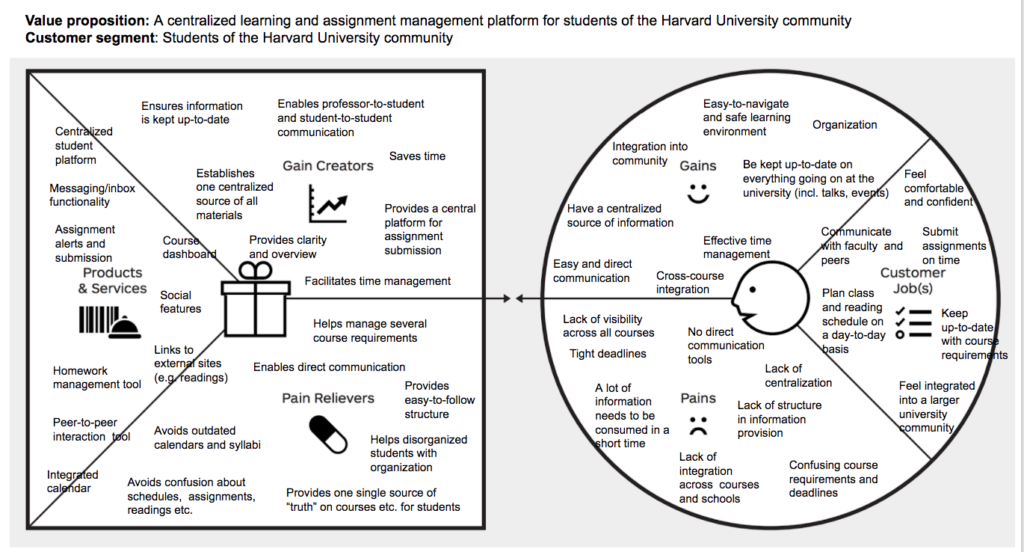
A more complex example would be Harvard University building a Learning Management system for delivering education:
By working in this manner with clients, we de-risk projects and maximise returns to ensure the best outcomes for the business, it’s stakeholders and the customer.
-


- tableau business intelligence
-
- Power BI Business Intelligence
-

- R statistical analysis
Business intelligence and Reporting are critical for generating insights on both customer and business data. Data visualisation tools like Tableau and Microsoft Power BI offer highly accessible means to unlock complex information and deliver critical inisights in a format that can be easily digested by management and analysts within the business.
Your business can take advantage of user friendly and powerful applications such as Tableau or Microsoft BI to harness this information into more useful dashboards with deeper insights and decision support for your business.
Advances in business intelligence have, in many cases, eliminated the need for code and programming to get at insights used for strategic and and tactical decision making. Click here for an excellent article on the key benefits of business intelligence and why this is essential for your business.
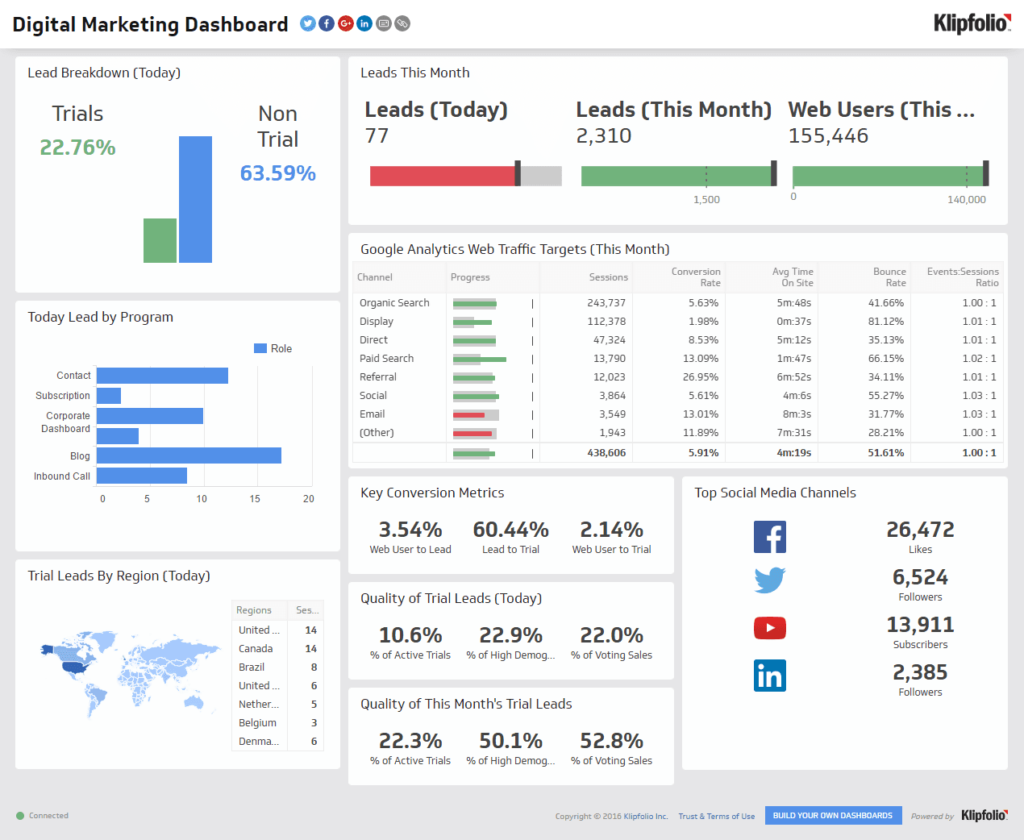
These are examples of Business Intelligence Reporting for Marketing and Sales:
Digital Marketing Dashboard
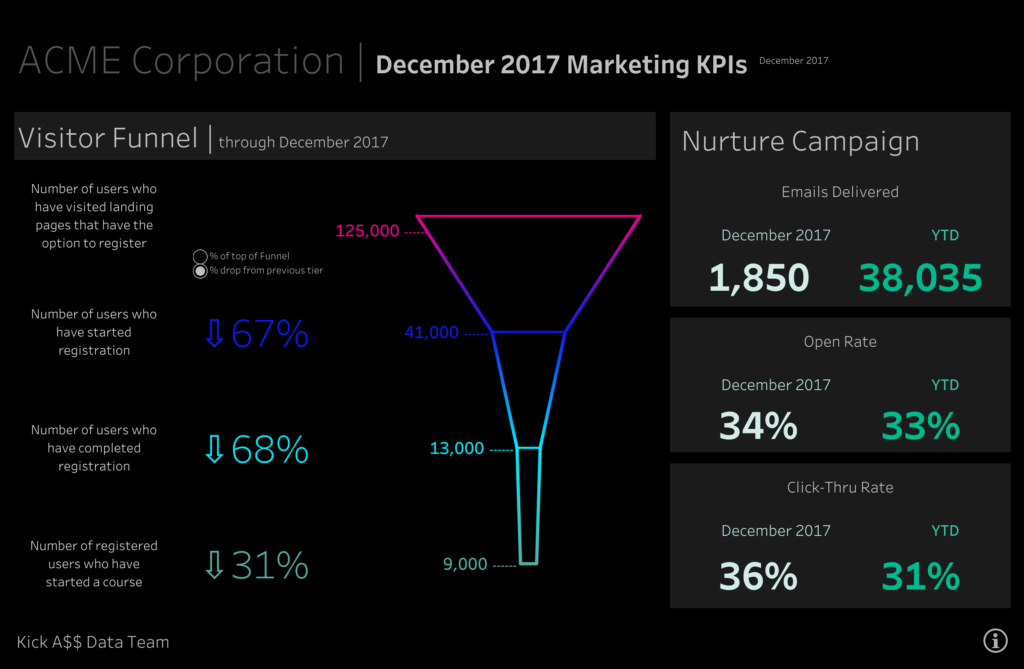
Marketing Funnel Report
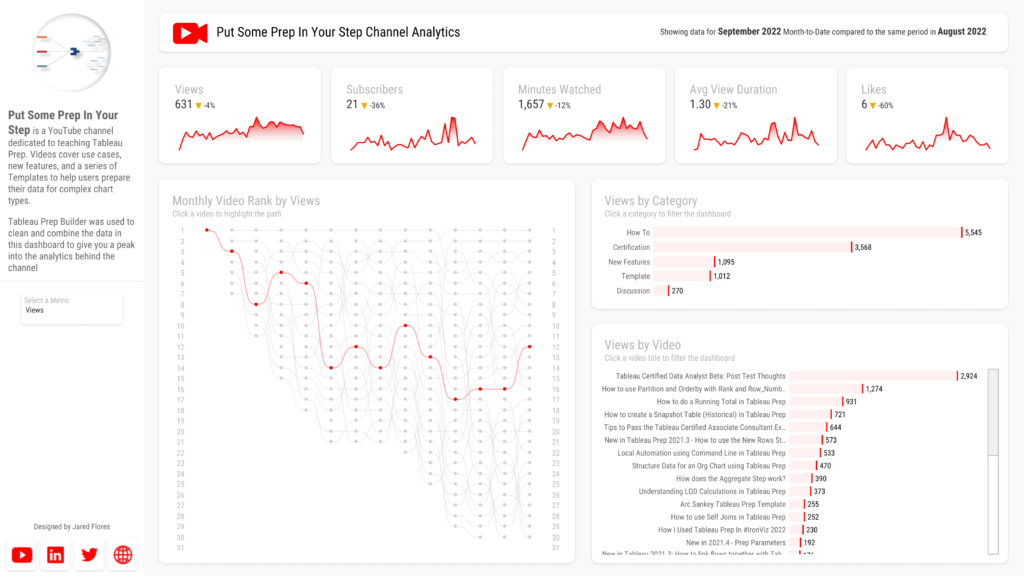
 Youtube Video Performance Tracking
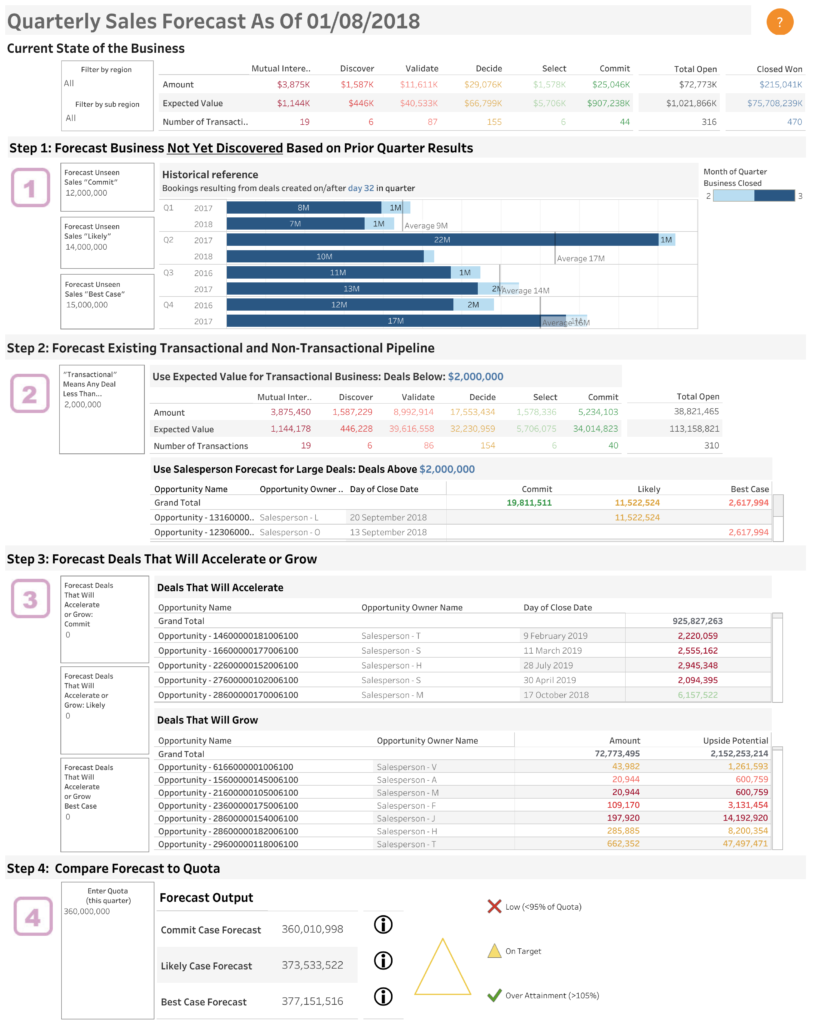
Sales Dashboard
Pictures can tell a thousand words and when you see the power of data visualisation, you will never want to go back to spreadsheets. Click the images below to access Tableau data visualisation reports.
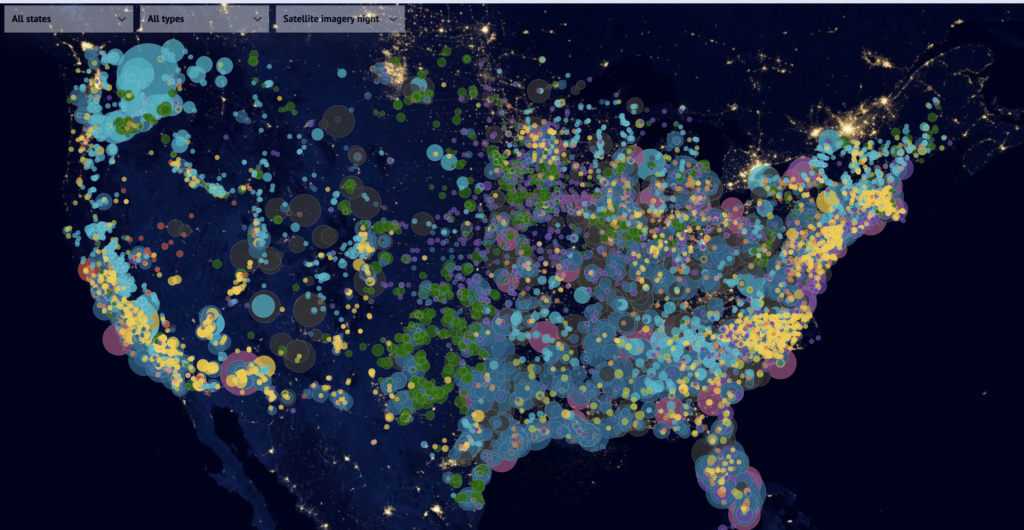
The report below allows the user to see a visual representation of how the US generates electricity. The report allows the user to filter the report by any or all types of electricity generation including Nuclear, gas, solar and many more. (Click image to see the report)
Interactive Sales Dashboard
New York City Population Data Visualisation
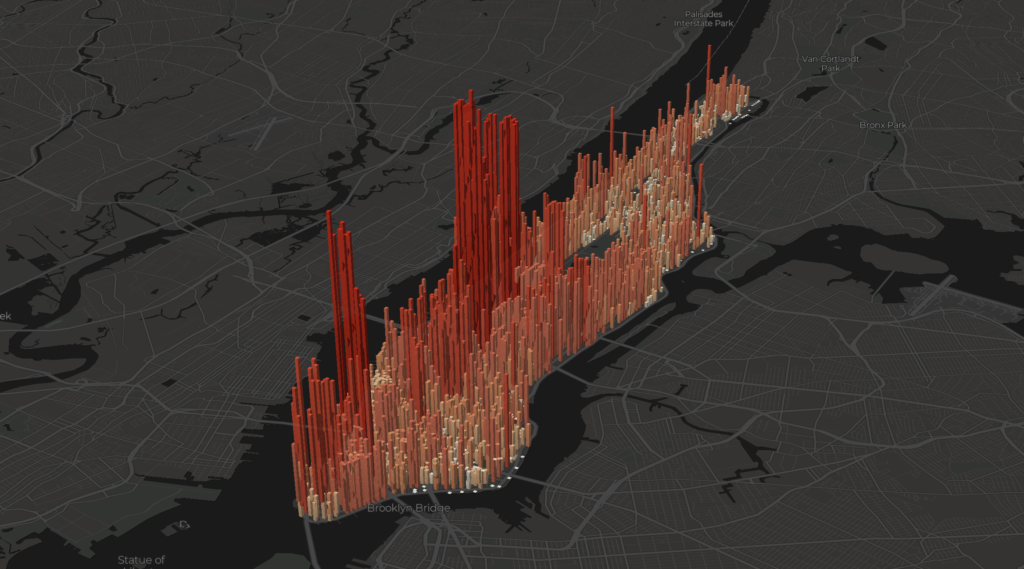
The report below allows you to study the dynamic changing population of New York City. The report allows the user to change the times of day within the report to see how this affects the change in population totals. (Click image to see the report)
US Sources of Electricity